David Nweze Umahi CON, a Nigerian politician and current Nigerian minister of works
Sponsored Advert
🔴 Breaking News:
By Abidemi Adebamiwa
Nigeria’s Minister of Works, David Umahi, has again defended the ₦7.5 billion-per-kilometre cost of the Lagos Calabar Coastal Highway. The 700-kilometre project would total roughly ₦5.25 trillion, a price that has stirred public concern over transparency and value. Umahi maintains the cost includes solar lighting, shoreline protection, bridges, and retaining walls, insisting his integrity is “at stake.”
In April 2024, the Minister told Channels Television that the highway would cost ₦4 billion per kilometre—making the current claim nearly double that figure. BusinessDay Nigeria reported in 2025 that the national road-building average is about ₦3.7 billion per km, already one of the highest in Africa. For context, Kenya’s Nairobi–Mombasa expressway, financed through a $3.6 billion deal, averages roughly ₦4 billion per km.
While Nigeria’s figure is steep, coastal projects often cost more. The Federal Ministry of Works cites Bangladesh highways ranging from $6.6 million to $11.9 million per km (₦8–14 billion) depending on terrain. Globally, India’s Mumbai Coastal Road reaches about ₦20 billion per km due to tunnels and sea defenses, while France’s Réunion Island sea-viaduct exceeds ₦150 billion per km—making Nigeria’s plan costly but not unprecedented.
Sponsored
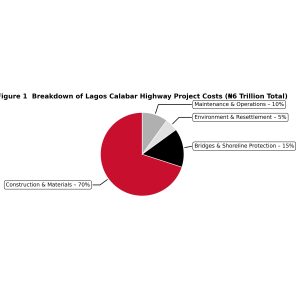
Lagos Calabar Highway Cost Breakdown Chart
Figure 1: Construction and materials account for roughly 70 percent of total life-cycle cost, with shoreline protection and bridges at 15 percent, maintenance 10 percent, and environmental or resettlement costs 5 percent.
If efficiently managed, the project could yield strong returns. A conservative analysis projects annual economic benefits near ₦695 billion through faster travel, reduced vehicle costs, tourism growth, job creation, and land appreciation.
Sponsored
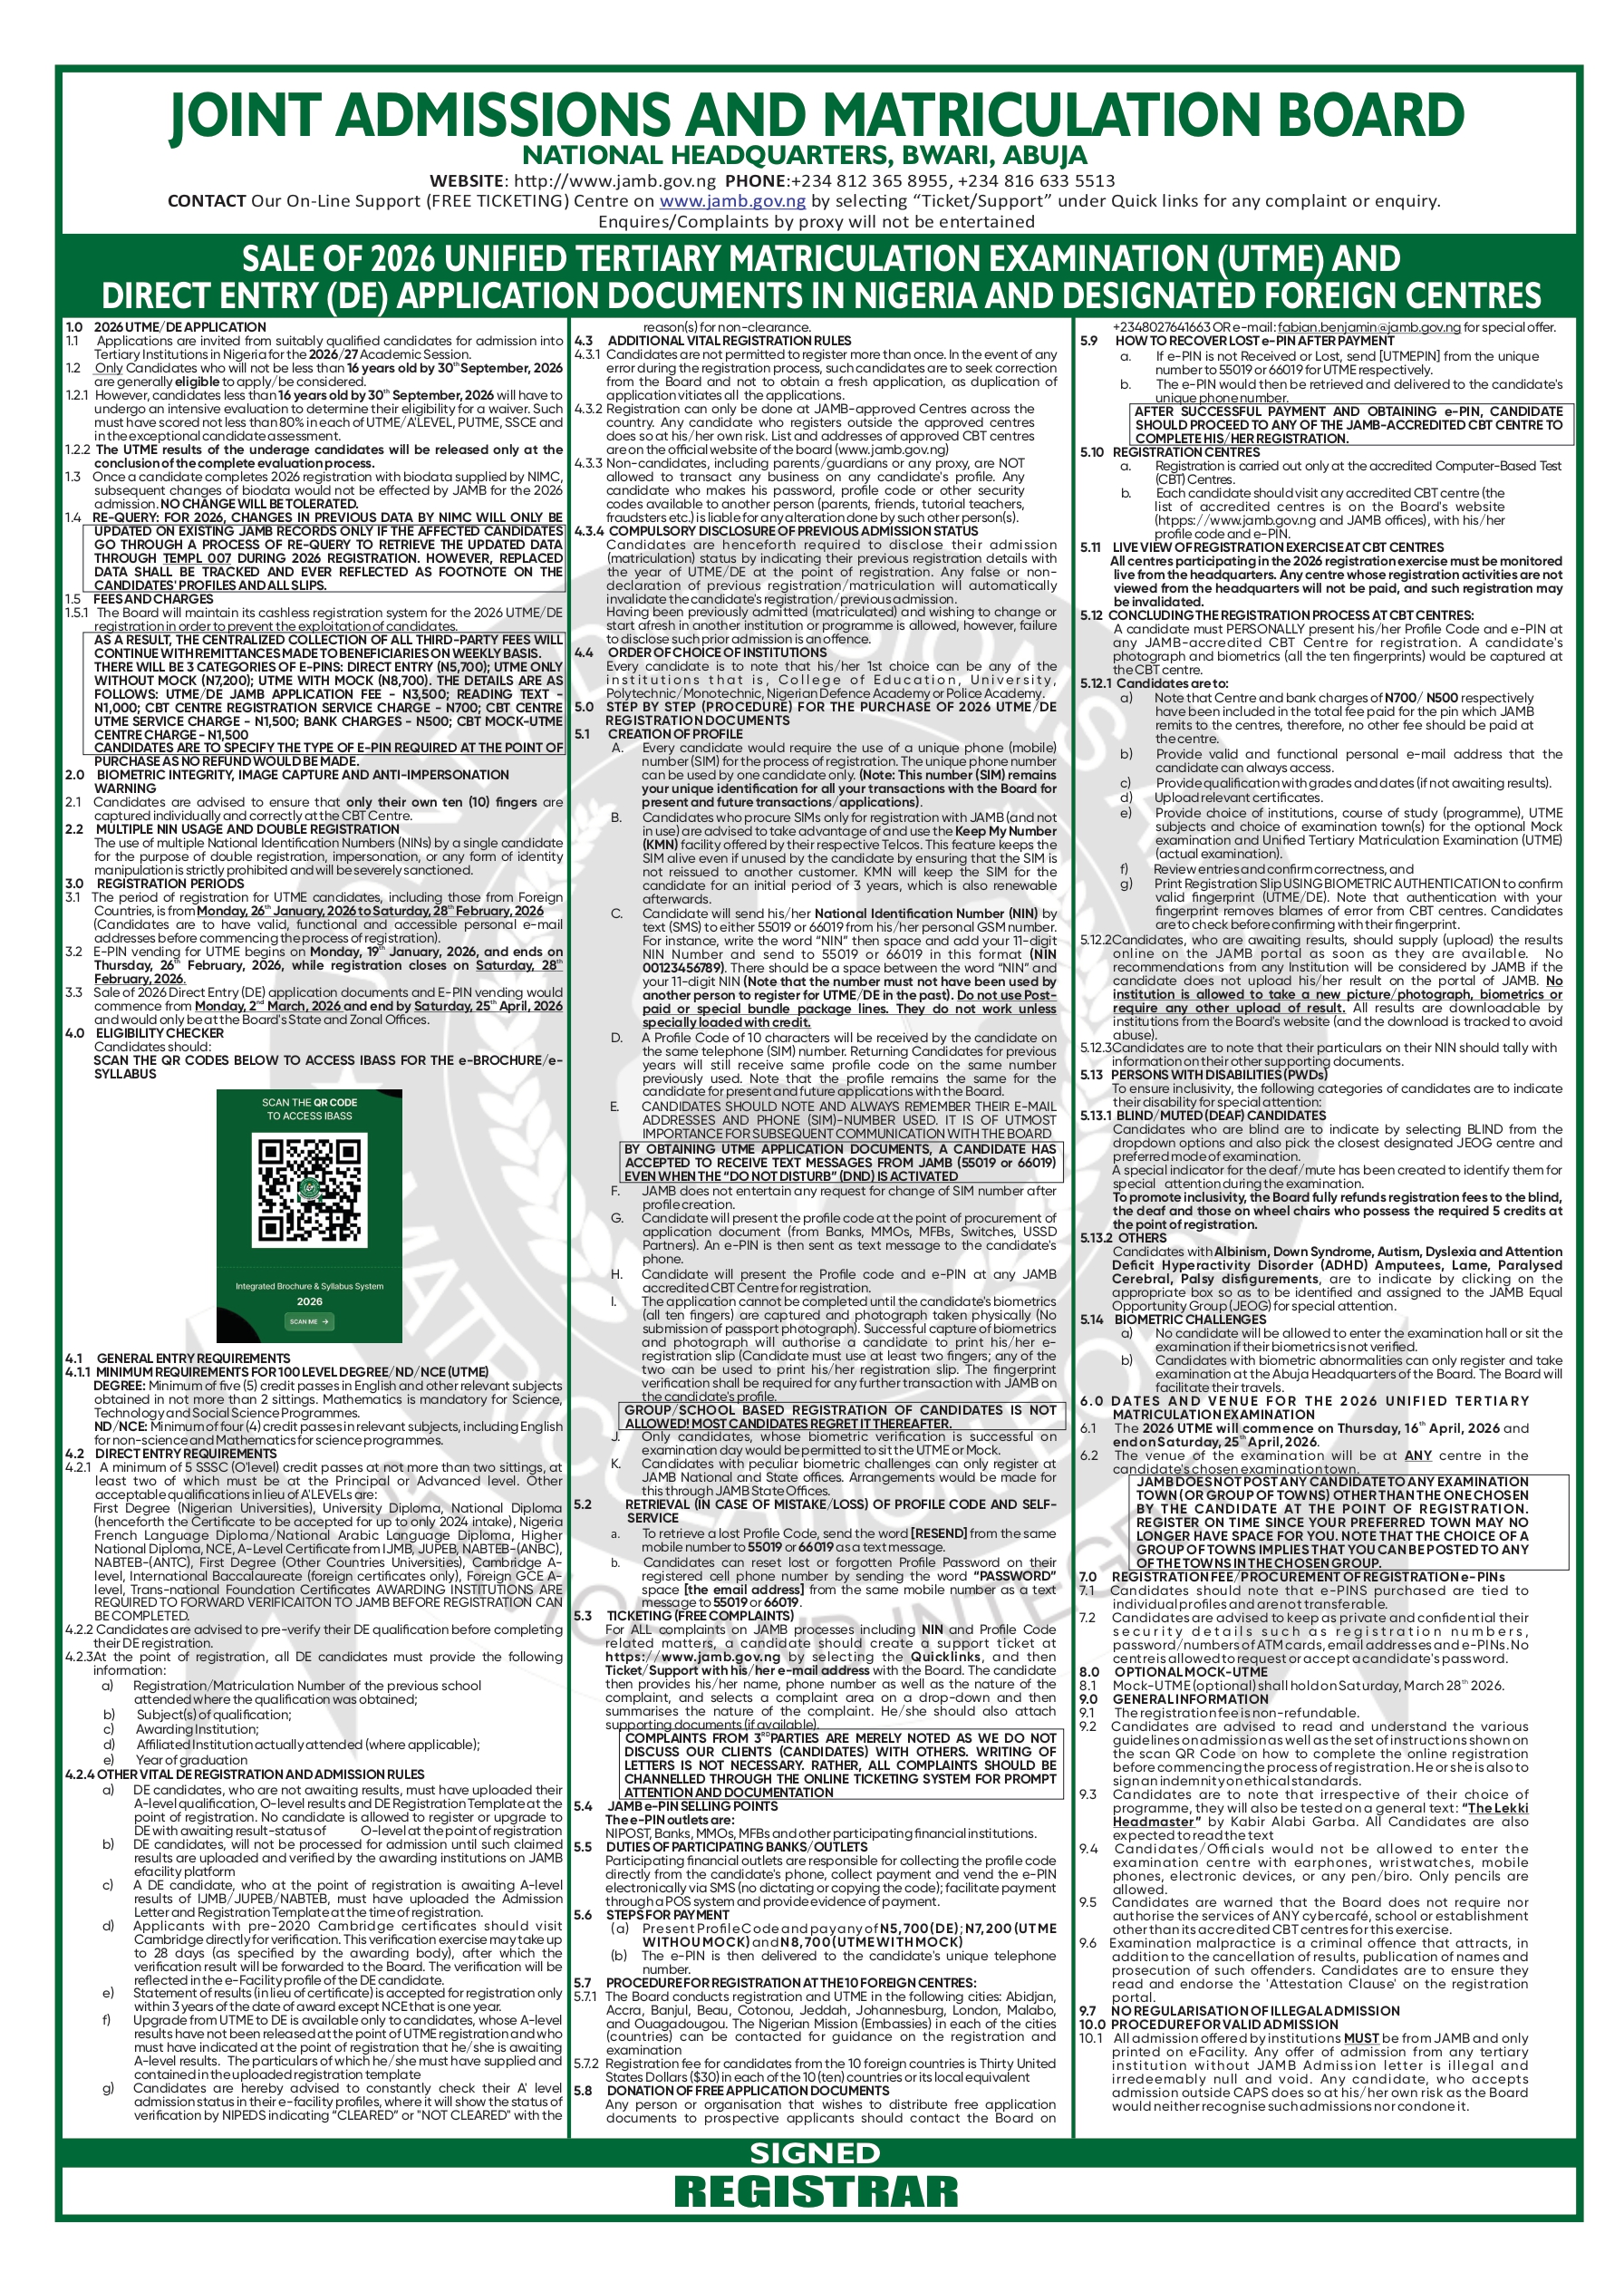
Annual Economic Benefits of Lagos Calabar Coastal Highway
Figure 2: Employment and multiplier effects drive the largest share of benefits, followed by vehicle-cost savings and land-value growth across six coastal states.
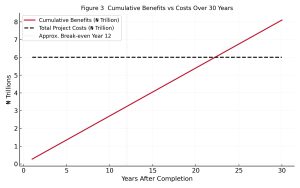
Over 30 years, cumulative benefits could reach about ₦8.1 trillion against ₦6 trillion in total cost. That yields a benefit-to-cost ratio of roughly 1.35 to 1, suggesting modest economic viability if spending remains disciplined and inflation controlled.
Advertisement
Cumulative Benefits vs Costs Over 30 Years Chart
Figure 3: The break-even point appears around the twelfth year after completion; sustained maintenance and toll funding are essential to keep benefits above cost.
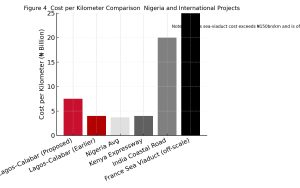
Comparisons with peer projects reinforce the need for transparency.
Global Cost per Kilometre Comparison Bar Graph
Figure 4: Nigeria’s ₦7.5 billion per km far exceeds its own average and Kenya’s rate. France’s sea-viaduct (₦150 billion per km) remains off-scale, illustrating how marine works multiply costs.
The Environmental and Social Impact Assessment (ESIA) published by the Federal Ministry of Environment currently covers only Section 1 of the route. Extending it to the full corridor is critical for accountability. The Lagos Calabar highway could transform coastal commerce—linking ports, refineries, and tourism hubs—or it could become another inflated public-works cautionary tale.
Nigeria’s taxpayers deserve clarity. Releasing the full Bill of Quantities, financing details, and environmental obligations would prove whether ₦7.5 billion per kilometre reflects genuine engineering necessity or simply another expensive promise waiting to unravel.
Abidemi is a policy analyst with advanced degrees and certification from Northwestern University and Harvard Business School and the Managing Editor of Newspot Nigeria.
Used to distinguish new sessions and visits. This cookie is set when the GA.js javascript library is loaded and there is no existing __utmb cookie. The cookie is updated every time data is sent to the Google Analytics server.
30 minutes after last activity
__utmc
Used only with old Urchin versions of Google Analytics and not with GA.js. Was used to distinguish between new sessions and visits at the end of a session.
End of session (browser)
__utmz
Contains information about the traffic source or campaign that directed user to the website. The cookie is set when the GA.js javascript is loaded and updated when data is sent to the Google Anaytics server
6 months after last activity
__utmv
Contains custom information set by the web developer via the _setCustomVar method in Google Analytics. This cookie is updated every time new data is sent to the Google Analytics server.
2 years after last activity
__utmx
Used to determine whether a user is included in an A / B or Multivariate test.
18 months
_ga
ID used to identify users
2 years
_gali
Used by Google Analytics to determine which links on a page are being clicked
30 seconds
_ga_
ID used to identify users
2 years
_gid
ID used to identify users for 24 hours after last activity
24 hours
_gat
Used to monitor number of Google Analytics server requests when using Google Tag Manager
1 minute
_gac_
Contains information related to marketing campaigns of the user. These are shared with Google AdWords / Google Ads when the Google Ads and Google Analytics accounts are linked together.
90 days
__utma
ID used to identify users and sessions
2 years after last activity
__utmt
Used to monitor number of Google Analytics server requests